前言
按进程对资源使用情况的不同,进程有不同的状态。以top输出为例:
xxxxxxxxxx91[root@centos ~]# top2Tasks: 169 total,   2 running, 167 sleeping,   0 stopped,   0 zombie                # 按 H 大写 切换tasks/threads3
4# 进程的5种状态码:5D 不可中断 uninterruptible sleep (usually IO)6R 运行 runnable (on run queue)7S 中断 sleeping8T 停止 traced or stopped9Z 僵死 a defunct (”zombie”) process
Linux Hung
本文不讨论Zombie(僵死)进程。长期以来,处于 D 状态的进程都是让人比较烦恼的问题,此时不能接收信号,不能 kill 掉,用户对此基本是无能为力,而且也很难知道发生的原因,一般来说只能重启服务器恢复。在DevOps工作实践中,在安装有安全类软件及NFS共享挂载的服务器节点上出现此类情况的可能性稍高。
正常来说 D 状态的任务只有在 IO 操作时会有,而且会很快完成,只有在极端的异常场景下才会出现问题,例如磁盘损坏、NFS 的 bug 等等,不过如果驱动写的完善的话,一般会增加超时机制,原则上不会出现永久的 D 状态进程。
也就是说,只有在内核驱动不合理的时候可能会导致进程长期处于 D 状态,无法唤醒,类似于死锁状态。
技术细节
针对这种情况,内核在 3.10.0 版本之后提供了 hung task 机制,用来检测系统中长期处于 D 状体的进程,如果存在,则打印相关警告和进程堆栈。
如果配置了 hung_task_panic ,则会直接发起 panic 操作,然后结合 kdump 可以搜集到相关的 vmcore 文件,用于定位分析。
其基本原理也很简单,系统启动时会创建一个内核线程 khungtaskd,定期遍历系统中的所有进程,检查是否存在处于 D 状态且超过 120s 的进程,如果存在,则打印相关警告和进程堆栈,并根据参数配置决定是否发起 panic 操作。
注:panic是英文中是惊慌的意思,Linux Kernel panic正如其名,linux kernel不知道如何走了,它会尽可能把它此时能获取的全部信息都打印出来。后面章节附录相应章节。
配置参数
与 hung task 相关的配置项主要有如下几个,可以直接通过 echo 'value' > /path/to/file 的方式进行修改。
x
1# centos7.92[root@666 ~]# cat /proc/sys/kernel/hung_task_timeout_secs # 处于D状态的超时时间,默认是120s31204[root@666 ~]# cat /proc/sys/kernel/hung_task_panic # 发现hung task之后是否触发panic操作506[root@666 ~]# cat /proc/sys/kernel/hung_task_check_count # 每次检查的进程数741943048[root@666 ~]# cat /proc/sys/kernel/hung_task_warnings # 为了防止日志被刷爆,设置最多的打印次数91010[root@666 ~]#11
实践演示
找一台任务少的服务器节点,将超时参数调整程稍小,马上就可收到日志输出:
xxxxxxxxxx141INFO: task ps:211718 blocked for more than 120 seconds.2"echo 0 > /proc/sys/kernel/hung_task_timeout_secs" disables this message.3[46953.928424] ps D ffffffff816ac3a9 0 211718 211717 0x000000804[46953.928426] Call Trace:5[46953.928429] [<ffffffff816acc49>] schedule+0x29/0x706[46953.928431] [<ffffffff816ae5c5>] rwsem_down_read_failed+0xf5/0x1707[46953.928434] [<ffffffff81341a28>] call_rwsem_down_read_failed+0x18/0x308[46953.928439] [<ffffffff816abb60>] down_read+0x20/0x309[46953.928442] [<ffffffff811ba6f1>] __access_remote_vm+0x51/0x1f010[46953.928445] [<ffffffff811c145f>] access_remote_vm+0x1f/0x3011[46953.928448] [<ffffffff81286573>] proc_pid_cmdline_read+0x193/0x56012[46953.928452] [<ffffffff8120f4ff>] vfs_read+0x9f/0x17013[46953.928456] [<ffffffff812100df>] SyS_read+0x7f/0xe014[46953.928460] [<ffffffff816b9195>] system_call_fastpath+0x1c/0x21
内核分析
在内核启动时会在 hung_task_init() 函数中启动一个内核线程。
xxxxxxxxxx91hung_task_init()2 |-atomic_notifier_chain_register() 注册panic通知链,在发生panic时执行相关的操作3 |-kthread_run() 启动一个内核线程,处理函数为watchdog(),线程名为khungtaskd4 |-watchdog()5 |-set_user_nice() 设置为普通优先级,不影响业务运行6 |-schedule_timeout_interruptible() 设置内核定时器,默认为120s7 |-atomic_xchg() 检测是否需要运行8 |-check_hung_uninterruptible_tasks() 真正执行检测9 |-check_hung_task()在 check_hung_uninterruptible_tasks() 函数中会设置每次检查的进程数,以及批量检查的上限 HUNG_TASK_BATCHING 。
打印调试信息的时候需要在编译时打开 CONFIG_DEBUG_MUTEXS 开关。
内核通知链
在 Linux 内核中,各子系统之间有很强的关联关系,例如某些子系统可能对其它子系统产生的事件感兴趣。
为了在各个子系统之间发送信息,Linux 内核引入了通知链技术,只在内核的子系统之间使用,而不能够在内核和用户空间进行事件的通知。
磁盘io导致hung
注:本章节是实际遇到的问题场景,其它章节为相关知识。
服务器无法登陆,强制重启可登陆。输出日志:
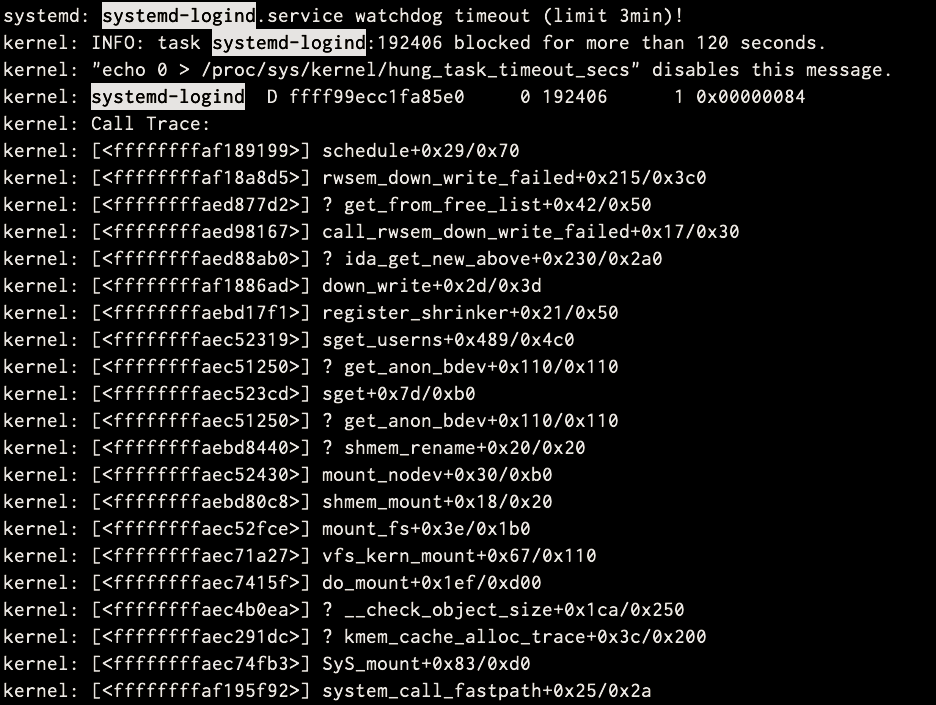
This indicates that the process requested a block device such as a disk/swap, and wasn’t able to be fulfilled for more than 120 seconds and subsequently abandoned by the kernel.
xxxxxxxxxx1201THE PROBLEM:2When we run very stressful jobs running on large servers (large number of CPU’s and RAM memory), where IO activity is very high. It is pretty common to start seeing these messages on the ‘dmesg’ kernel output:3
实践演示
找一台任务少的服务器节点,将超时参数调整程稍小,马上就可收到日志输出:
xxxxxxxxxx141INFO: task ps:211718 blocked for more than 120 seconds.2"echo 0 > /proc/sys/kernel/hung_task_timeout_secs" disables this message.3[46953.928424] ps D ffffffff816ac3a9 0 211718 211717 0x000000804[46953.928426] Call Trace:5[46953.928429] [<ffffffff816acc49>] schedule+0x29/0x706[46953.928431] [<ffffffff816ae5c5>] rwsem_down_read_failed+0xf5/0x1707[46953.928434] [<ffffffff81341a28>] call_rwsem_down_read_failed+0x18/0x308[46953.928439] [<ffffffff816abb60>] down_read+0x20/0x309[46953.928442] [<ffffffff811ba6f1>] __access_remote_vm+0x51/0x1f010[46953.928445] [<ffffffff811c145f>] access_remote_vm+0x1f/0x3011[46953.928448] [<ffffffff81286573>] proc_pid_cmdline_read+0x193/0x56012[46953.928452] [<ffffffff8120f4ff>] vfs_read+0x9f/0x17013[46953.928456] [<ffffffff812100df>] SyS_read+0x7f/0xe014[46953.928460] [<ffffffff816b9195>] system_call_fastpath+0x1c/0x21
内核分析
在内核启动时会在 hung_task_init() 函数中启动一个内核线程。
xxxxxxxxxx91hung_task_init()2 |-atomic_notifier_chain_register() 注册panic通知链,在发生panic时执行相关的操作3 |-kthread_run() 启动一个内核线程,处理函数为watchdog(),线程名为khungtaskd4 |-watchdog()5 |-set_user_nice() 设置为普通优先级,不影响业务运行6 |-schedule_timeout_interruptible() 设置内核定时器,默认为120s7 |-atomic_xchg() 检测是否需要运行8 |-check_hung_uninterruptible_tasks() 真正执行检测9 |-check_hung_task()在 check_hung_uninterruptible_tasks() 函数中会设置每次检查的进程数,以及批量检查的上限 HUNG_TASK_BATCHING 。
打印调试信息的时候需要在编译时打开 CONFIG_DEBUG_MUTEXS 开关。
内核通知链
在 Linux 内核中,各子系统之间有很强的关联关系,例如某些子系统可能对其它子系统产生的事件感兴趣。
为了在各个子系统之间发送信息,Linux 内核引入了通知链技术,只在内核的子系统之间使用,而不能够在内核和用户空间进行事件的通知。
磁盘io导致hung
注:本章节是实际遇到的问题场景,其它章节为相关知识。
服务器无法登陆,强制重启可登陆。输出日志:
This indicates that the process requested a block device such as a disk/swap, and wasn’t able to be fulfilled for more than 120 seconds and subsequently abandoned by the kernel.
xxxxxxxxxx1201THE PROBLEM:2When we run very stressful jobs running on large servers (large number of CPU’s and RAM memory), where IO activity is very high. It is pretty common to start seeing these messages on the ‘dmesg’ kernel output:3
4[24169.372862] INFO: task kswapd1:1140 blocked for more than 120 seconds.5[24169.375623] Tainted: G E 4.9.51-10.52.amzn1.x86_64 #16[24169.378445] "echo 0 > /proc/sys/kernel/hung_task_timeout_secs" disables this message.7[24169.382533] kswapd1 D 0 1140 2 0x000000008[24169.385066] ffff8811605c5a00 0000000000000000 ffff8823645dc900 ffff8823628449009[24169.389208] ffff882371357c00 ffffc9001a13ba08 ffffffff8153896c ffffc9001a13ba1810[24169.393329] ffff881163ac92d8 ffff88115e87f400 ffff882362844900 ffff88115e87f46c11[24169.445313] Call Trace:12[24169.446981] [<ffffffff8153896c>] ? __schedule+0x23c/0x68013[24169.449454] [<ffffffff81538de6>] schedule+0x36/0x8014[24169.451790] [<ffffffff8153907e>] schedule_preempt_disabled+0xe/0x1015[24169.454509] [<ffffffff8153a8d5>] __mutex_lock_slowpath+0x95/0x11016[24169.457156] [<ffffffff8153a967>] mutex_lock+0x17/0x2717[24169.459546] [<ffffffffa0966d00>] xfs_reclaim_inodes_ag+0x2b0/0x330 [xfs]18[24169.462407] [<ffffffffa0967be3>] xfs_reclaim_inodes_nr+0x33/0x40 [xfs]19[24169.465203] [<ffffffffa0978f59>] xfs_fs_free_cached_objects+0x19/0x20 [xfs]20...21
22WHY IS THIS HAPPENING?23This indicates that the process requested a block device such as a disk/swap, and wasn’t able to be fulfilled for more than 120 seconds and subsequently abandoned by the kernel.24
25As mentioned before, the probability of observing this behavior will increase when we use instances with large number of vCores (e.g. 64+ vCores), given that the volume of IO requests could be higher, and, the kernel buffer queues not configured for such load.26
27This is also very common on clustered environments. Even though the framework will retry, on Hadoop/YARN environments, this will impact in performance, and, might also lead to application failures.28
29THE SOLUTION:30To solve this problem, we have to increase the ‘dirty_background_bytes‘ kernel setting  to higher values to be able to accommodate the throughput.31
32As a base formula, we usually consider a value of dirty_background_bytes=10MB for 40MB/Sec throughput.33
34The goal is to have the page cache to allow the OS to write asynchronously to disk whenever possible. Otherwise, when the write becomes synchronous, it would involve a waiting time.35
36Additionally to the dirty_background_bytes kernel parameter, we can also set:37
38dirty_background_ratio = 10 (represents the percentage of system memory which when dirty then system can start writing data to the disks. When the dirty pages exceed ratio 10, I/O starts, i.e they start getting flushed / written to the disk)39dirty_ratio = 15 (is percentage of system memory which when dirty, the process doing writes would block and write out dirty pages to the disks. When total number of dirty pages exceed ratio 15, all writes get blocked until some of the dirty pages get written to disk. This is like an upper limit)40We try to keep these two values low to avoid  I/O bottlenecks. We can experiment setting both down to zero, to force fast flushes on high stress environments.41
42Another parameter we can use is dirty_bytes, which represents the amount of dirty memory at which a process generating disk writes will itself start writeback. We should set dirty_ratio = 0 if we set dirty_bytes, as only one of these might be specified at a time.43
44e.g.45
46dirty_bytes = 214748364847
48
sysctl更多参数参考:https://www.kernel.org/doc/Documentation/sysctl/vm.txt
附录
Linux Kernel Panic
本章节引自 linux panic机制 , 稍作格式化处理,以防原文下线,读者可以自行选阅。
panic是英文中是惊慌的意思,Linux Kernel panic正如其名,linux kernel不知道如何走了,它会尽可能把它此时能获取的全部信息都打印出来。
有两种主要类型kernel panic,后面会对这两类panic做详细说明:
1.hard panic(也就是Aieee信息输出) 2.soft panic (也就是Oops信息输出)
- 常见Linux Kernel Panic报错内容:
(1) Kernel panic-not syncing fatal exception in interrupt (2) kernel panic – not syncing: Attempted to kill the idle task! (3) kernel panic – not syncing: killing interrupt handler! (4) Kernel Panic – not syncing:Attempted to kill init !
什么会导致Linux Kernel Panic?
只有加载到内核空间的驱动模块才能直接导致kernel panic,你可以在系统正常的情况下,使用lsmod查看当前系统加载了哪些模块。 除此之外,内建在内核里的组件(比如memory map等)也能导致panic。
因为hard panic和soft panic本质上不同,因此我们分别讨论。
hard panic
一般出现下面的情况,就认为是发生了kernel panic:
- 机器彻底被锁定,不能使用
- 数字键(Num Lock),大写锁定键(Caps Lock),滚动锁定键(Scroll Lock)不停闪烁。
- 如果在终端下,应该可以看到内核dump出来的信息(包括一段”Aieee”信息或者”Oops”信息)
- 和Windows蓝屏相似
原因
对于hard panic而言,最大的可能性是驱动模块的中断处理(interrupt handler)导致的,一般是因为驱动模块在中断处理程序中访问一个空指针(null pointre)。一旦发生这种情况,驱动模块就无法处理新的中断请求,最终导致系统崩溃。
本人就曾遇到过这样一个例子:在多核系统中,包括AP应用处理器、mcu微控制器和modem处理器等系统中,mcu控制器用于系统的低功耗控制,mcu微控制器由于某种原因超时向AP应用处理器发送一个超时中断,AP接受中断后调用中断处理函数读取mcu的状态寄存器,发现是mcu的超时中断,就在中断处理程序中主动引用一个空指针,迫使AP处理器打印堆栈信息然后重启linux系统。这就是一个典型的hard panic,这里不对mcu超时原因做深入的分析,只是用来说明hard panic产生的机理。
信息收集
根据panic的状态不同,内核将记录所有在系统锁定之前的信息。因为kenrel panic是一种很严重的错误,不能确定系统能记录多少信息,下面是一些需要收集的关键信息,他们非常重要,因此尽可能收集全,当然如果系统启动的时候就kernel panic,那就无法只知道能收集到多少有用的信息了。
- /var/log/messages: 幸运的时候,整个kernel panic栈跟踪信息都能记录在这里,当然对于嵌入式linux系统,kernel panic的内核打印信息被放到/data/dontpanic目录下,包括两个文件:apanic_console存放的是内核控制台的log,apanic_threads存放的是linux kernel发生panic时的所有内核线程的堆栈信息。
- 应用程序/库 日志: 可能可以从这些日志信息里能看到发生panic之前发生了什么。
- 其他发生panic之前的信息,或者知道如何重现panic那一刻的状态
- 终端屏幕dump信息,一般OS被锁定后,复制,粘贴肯定是没戏了,因此这类信息,你可以需要借助数码相机或者原始的纸笔工具了。
如果kernel dump信息既没有在/var/log/message里,也没有在屏幕上,那么尝试下面的方法来获取(当然是在还没有死机的情况下):
如果在图形界面,切换到终端界面,dump信息是不会出现在图形界面的,甚至都不会在图形模式下的虚拟终端里。
确保屏幕不黑屏,可以使用下面的几个方法:
- setterm -blank 0
- setterm -powerdown 0
- setvesablank off
从终端,拷贝屏幕信息(方法见上)
实际上,当内核发生panic时,linux系统会默认立即重启系统,当然这只是默认情况,除非你修改了产生panic时重启定时时间,这个值默认情况下是0,即立刻重启系统。所以当panic时没有把kernel信息导入文件的话,那么可能你很难再找到panic产生的地方。
3.3 完整栈跟踪信息的排查方法
栈跟踪信息(stack trace)是排查kernel panic最重要的信息,该信息如果在/var/log/messages日志里当然最好,因为可以看到全部的信息,如果仅仅只是在屏幕上,那么最上面的信息可能因为滚屏消失了,只剩下栈跟踪信息的一部分。如果你有一个完整栈跟踪信息的话,那么就可能根据这些充分的信息来定位panic的根本原因。要确认是否有一个足够的栈跟踪信息,你只要查找包含”EIP”的一行,它显示了是什么函数和模块调用时导致panic。
使用内核调试工具(kenrel debugger ,aka KDB)
如果跟踪信息只有一部分且不足以用来定位问题的根本原因时,kernel debugger(KDB)就需要请出来了。 KDB编译到内核里,panic发生时,他将内核引导到一个shell环境而不是锁定。这样,我们就可以收集一些与panic相关的信息了,这对我们定位问题的根本原因有很大的帮助。
使用KDB需要注意,内核必须是基本核心版本,比如是2.4.18,而不是2.4.18-5这样子的,因为KDB仅对基本核心有效。
soft panic
症状
- 没有hard panic严重
- 通常导致段错误(segmentation fault)
- 可以看到一个oops信息,/var/log/messages里可以搜索到’Oops’
- 机器稍微还能用(但是收集信息后,应该重启系统)
原因
凡是非中断处理引发的模块崩溃都将导致soft panic。在这种情况下,驱动本身会崩溃,但是还不至于让系统出现致命性失败,因为它没有锁定中断处理例程。导致hard panic的原因同样对soft panic也有用(比如在运行时访问一个空指针)
信息收集
当soft panic发生时,内核将产生一个包含内核符号(kernel symbols)信息的dump数据,这个将记录在/var/log/messages里。为了开始排查故障,可以使用ksymoops工具来把内核符号信息转成有意义的数据。
为了生成ksymoops文件,需要:
- 从/var/log/messages里找到的堆栈跟踪文本信息保存为一个新文件。确保删除了时间戳(timestamp),否则ksymoops会失败。
- 运行ksymoops程序(如果没有,请安装)
- 详细的ksymoops执行用法,可以参考ksymoops(8)手册。
Kernel panic实例
今天就遇到 一个客户机器内核报错:“Kernel panic-not syncing fatal exception”,重启后正常,几个小时后出现同样报错,系统down了,有时重启后可恢复有时重启后仍然报同样的错误。
- 什么是fatal exception?
“致命异常(fatal exception)表示一种例外情况,这种情况要求导致其发生的程序关闭。通常,异常(exception)可能是任何意想不到的情况(它不仅仅包括程序错误)。致命异常简单地说就是异常不能被妥善处理以至于程序不能继续运行。
软件应用程序通过几个不同的代码层与操作系统及其他应用程序相联系。当异常(exception)在某个代码层发生时,为了查找所有异常处理的代码,各个代码层都会将这个异常发送给下一层,这样就能够处理这种异常。如果在所有层都没有这种异常处理的代码,致命异常(fatal exception)错误信息就会由操作系统显示出来。这个信息可能还包含一些关于该致命异常错误发生位置的秘密信息(比如在程序存储范围中的十六进制的位置)。这些额外的信息对用户而言没有什么价值,但是可以帮助技术支持人员或开发人员调试程序。
当致命异常(fatal exception)发生时,操作系统没有其他的求助方式只能关闭应用程序,并且在有些情况下是关闭操作系统本身。当使用一种特殊的应用程序时,如果反复出现致命异常错误的话,应将这个问题报告给软件供应商。 ” 而且此时键盘无任何反应,必然使用reset键硬重启。
panic.c源文件有个方法,当panic挂起后,指定超时时间,可以重新启动机器,这就是前面说的panic超时重启。如果你的机器事先配置好了魔法键的使用,就可以在超时之前通过魔法键使系统在重启前尽可能多的为你多做些事情,当然这些事情不是用来使系统恢复正常,而是尽量避免损失或导出一些有用信息来帮助后面的定位。
方法:
xxxxxxxxxx41#vi /etc/sysctl.conf  添加2
3kernel.panic = 20 #panic error中自动重启,等待timeout为20秒4kernel.sysrq=1    #激活Magic SysRq  否则,键盘鼠标没有响应5
按住 [ALT]+[SysRq]+[COMMAND], 这里SysRq是Print SCR键,而COMMAND按以下来解释!
b – 立即重启 e – 发送SIGTERM给init之外的系统进程 o – 关机 s – sync同步所有的文件系统 u – 试图重新挂载文件系统
配置一下以防万一。
很多网友安装linux出现“Kernel panic-not syncing fatal exception in interrupt”是由于网卡驱动原因。解决方法:将选项“Onboard Lan”的选项“Disabled”,重启从光驱启动即可。等安装完系统之后,再进入BIOS将“Onboard Lan”的选项给“enable”,下载相应的网卡驱动安装。
如出现以下报错:
x
1init() r8168 ... 2
3 ......4 5 ... :Kernel panic: Fatal exception6r8168是网卡型号。7在BIOS中禁用网卡,从光驱启动安装系统。再从网上下载网卡驱动安装。8#tar vjxf r8168-8.014.00.tar.bz29# make clean modules (as root or with sudo)10 # make install11 # depmod -a12 # modprobe r8168
安装好系统后reboot进入BIOS把网卡打开。
另有网友在Kernel panic出错信息中看到“alc880”,这是个声卡类型。尝试着将声卡关闭,重启系统,搞定。
安装linux系统遇到安装完成之后,无法启动系统出现Kernel panic-not syncing fatal exception。很多情况是由于板载声卡、网卡、或是cpu 超线程功能(Hyper-Threading )引起的。这类问题的解决办法就是先查看错误代码中的信息,找到错误所指向的硬件,将其禁用。系统启动后,安装好相应的驱动,再启用该硬件即可。
另外出现“Kernel Panic — not syncing: attempted to kill init”和“Kernel Panic — not syncing: attempted to kill idle task”有时把内存互相换下位置或重新插拔下可以解决问题。
- 一个kernel panic的解决之法
相信使用linux kernel开发过驱动的兄弟都知道,kernel panic对系统带来的危害要比应用程序panic大的多,甚至可以用灾难来形容。对于应用程序的panic最多导致linux系统杀掉该用户进程,但对于kernel panic就没办法了,因为kernel是整个系统的管理者,自己出现问题了(当然是不可恢复的异常)就只能等待重启了。
kernel panic的最大问题就是难于定位,对于一个开发者来说,有些kernel panic那简直就像是一场噩梦,上面主要说明了如何抓取kernel panic的方法和一些panic实例,当然,抓取panic的打印信息是解决panic的第一步也是关键一步,下面就根据自己曾碰到过的一个kernel panic做为实例来说明从出现panic到解决panic的一般方法。
- 抓取kernel panic信息
没错,正如前面说的,这是第一步也是非常关键的一步,如果要解决一个kernel panic当然必须首先要知道它产生的地方,也就是说产生panic的内核函数调用栈,当前的内核调用栈记录了产生kernel panic时的函数调用关系链,这里我不在贴出相关的打印实例,这样的kernel panic网上也到处都是,而且还有很多的文章来说明如何确定是哪个源文件的哪一行导致的panic,因此感兴趣的同学可以搜索一些这样的文章看看,这里指说明一下解决kernel panic的一般步骤和注意事项。
对于抓取kernel log的方法前面有介绍,这里不赘述,但想强调两点:
(1) 不管是什么样的panic,首先要抓取足够的内核打印信息,当然必要的情况下还需要搜集产生kernel panic时的应用程序的打印信息,对于Android系统来说就是logcat信息,在android嵌入式软件平台上其实有更好更全面的log搜集方法,那就是bugreport,它将产生此刻系统全方位的信息,对,没错,就是全方位的信息,包括内核、应用、内存、进程和处理器等所有相关信息,是一个非常好的调试工具,至于bugreport的工作原理感兴趣的同学自己查找下资料。
注意:bugreport的使用需注意两点:第一,它只能在系统正常运行的情况下使用,第二,正因为第一点,你需要在系统产生kernel panic重启系统后的第一时间使用bugreport导出所有信息,因为这所有信息中包含了上次系统重启的原因的相关log信息。
(2) 既然是抓取panic log信息,必然少不了复现panic这个过程,有的panic的产生时概率性随机的,就是说你不知道什么时候就可能会产生panic,因此请珍惜每一次复现panic的机会,起码要在复现panic之前准备好你要抓取的是那些信息,这些信息能否帮助你进一步定位panic,否则,不要在出现panic时手忙脚乱,不知道自己要什么,最好每次复现panic前计划好这次你要那些信息(可能每次抓取信息的重点不一样)。
注意:在工作中经常碰到这样一个现象:测试部门的同学好不容易发现一个问题,请开发同学定位,开发同学基本上没怎么分析问题就嚷着信息抓的不够没法定位,结果让测试同学半天甚至一天来复现这个问题,等复现了问题开发同学还没搞清楚自己到底要什么信息来定位,有的问题复现时的环境只能保持几分钟甚至几十秒钟,这势必会浪费了测试同学的劳动成果。
- 分析kernel panic
搜集了足够的panic信息,下面就是分析panic的时候了,对于一个panic问题,你要知道三点:
(1) 首先要对汇编语言有一定的了解,定位panic产生的C代码位置
其实就是根据当前内核线程的内核调用栈查找产生panic调用链,在panic log的前面几行已经显示了kernel panic的代码位置,但这个位置是相对于产生panic函数的偏移,你并不知道它到底是哪一行,这个时候你需要objdump反汇编器来对那个产生panic的镜像文件反汇编,然后根据panic信息的指示找到对应的汇编代码,对照C代码根据汇编上下文确定C代码行,其实,kernel panic的产生一般都是非法地址的引用,尤其是NULL指针的引用,这也比较容易定位出panic的C代码行。
(2) 分析导致panic的C代码行上下文,确定panic引入点
第一步应该会比较容易找到导致panic 的C代码行,根据产生panic的代码进一步找到panic的引入点,这一步可以搭配printk来定位(如果是大概率panic就更容易定位了),这一步相对第一步花费多一点的时间,如果是应用代码分析到这里已经差不多结束了,确定了panic引入点就可以修改代码进行回归测试了,但对于kernel来说要复杂的多。
正如之前曾碰到的panic,复现虽然不容易但是基本上在固定时间点左右就可以复现,我是用的脚本循环加载卸载wifi模块,每次都是大约500次左右产生panic,要知道必现的panic就容易解决的多了,但当时因为这500次的循环就要花费2个小时左右,而且环境还经常出现问题,导致我花费很长时间才定位出问题所在:每次的加载和卸载wifi模块都导致devices kset节点引用计数多减一,当devices kset的引用计数变为0的时候被系统回收,linux系统随后可能会出现N种panic现象,之后发现是因为wifi模块每次加载下载时对应的设备节点的引用计数增减失衡导致devices kset被多减一,然后发现是linux 内核核心代码的问题。
(3) 最好不要怀疑linux的核心代码,也不要试图去修改
正因为这一点,让我迟迟不敢确定是不是真的核心代码问题,linux的核心代码那可是数以万计的大牛经过千锤百炼的代码,岂容你轻易修改,经过进一步的分析这个panic是因为我们用的wifi卡是非标准媒体卡,走的是非标准流程,在这个流程中对wifi设备初始化时少了一次wifi设备节点的引用,但在卸载模块时同标准卡一样被解引用了。
(4)不要坚定的以为围绕着panic信息就能解决panic问题
还是上面的panic,实际上,上面提到的panic问题其实应该是很多的panic,这也是在后期复现panic时发现的,在加载卸载500次左右时必现panic,但却不是同一个panic,如果按照正常思路:既然是panic,就应该从panic信息下手,顺藤摸瓜一直追下去。如果是这样,这个问题恐怕永远也解决不了,因为你在复现一个panic时总是会有其他的panic出现,这回让你无所适从的。
通过对这些panic的log的分析,发现他们都有一个共性,在产生panic之前都有一段WARNING打印,也正是对这段打印的分析找出了问题的根源,对于这段WARNING的内容和分析过程不在这里说明,只为表达下面的观点:
事实证明,在碰到panic问题定位时,如果想当一段时间内定位不出来,又没有什么更好的思路时,你应该回头看看在panic之前kernel是否产生了哪些不太正常的log,这也许就是导致kernel panic的前兆或推手。
(5) 尽可能多的把握linux kernel的行为,对一些难啃的panic大胆猜测
这里的大胆猜测是建立在想当了解linux kernel行为上的有理性的推理,尽管有些猜测并不是完全正确的,但在你证明它是正确的过程中或许会有意外收获。对于wifi模块加载卸载的panic问题来说,我曾有过两次错误的猜测:
第一次,因为长时间的加载卸载都会出现panic,而且开始发现的panic是在kmem_cache_alloc函数中,因此猜测是内存泄露导致的内存耗尽,因此在后面的复现过程中我写了个脚本循环打印内存的使用情况,发现内存的占用一直稳定在一个正常的范围,证明了我的第一个猜测是错误的。
第二次,在看到devices 的内核对象kobject的名字在panic之前出现乱码的情况下(printk打印了名字),我曾大胆地做过猜测:linux kernel发生了踩内存现象,导致devices kset对象被破坏。随后做了各方面的努力来证明我的想法,结果发现几乎都是在第493次加载wifi模块时出现的panic问题,这让我很迷惑,如果是踩内存怎么可能固定在493次发生,虽然不能完全证明这个猜想是错误的,但这足以说明我的方向有问题。
如此反反复复,花费了我两个星期的时间才搞定这个panic,因此,kernel panic虽然难啃,但只要你愿意去尝试愿意去努力,就算最后拿不下这个panic,你也会学到很多很多的东西,包括linux kernel行为,这些会对你以后的学习产生很大的影响,在碰到这类问题一定是信心满满的。
debug-hunting
本章节引自 https://www.kernel.org/doc/Documentation/admin-guide/bug-hunting.rst , 稍作格式化处理,以防原文下线,读者可以自行选阅。
xxxxxxxxxx13781Bug hunting2===========3
4Kernel bug reports often come with a stack dump like the one below::5
6    ------------[ cut here ]------------7    WARNING: CPU: 1 PID: 28102 at kernel/module.c:1108 module_put+0x57/0x708    Modules linked in: dvb_usb_gp8psk(-) dvb_usb dvb_core nvidia_drm(PO) nvidia_modeset(PO) snd_hda_codec_hdmi snd_hda_intel snd_hda_codec snd_hwdep snd_hda_core snd_pcm snd_timer snd soundcore nvidia(PO) [last unloaded: rc_core]9    CPU: 1 PID: 28102 Comm: rmmod Tainted: P        WC O 4.8.4-build.1 #110    Hardware name: MSI MS-7309/MS-7309, BIOS V1.12 02/23/200911     00000000 c12ba080 00000000 00000000 c103ed6a c1616014 00000001 00006dc612     c1615862 00000454 c109e8a7 c109e8a7 00000009 ffffffff 00000000 f13f6a1013     f5f5a600 c103ee33 00000009 00000000 00000000 c109e8a7 f80ca4d0 c109f61714    Call Trace:15     [<c12ba080>] ? dump_stack+0x44/0x6416     [<c103ed6a>] ? __warn+0xfa/0x12017     [<c109e8a7>] ? module_put+0x57/0x7018     [<c109e8a7>] ? module_put+0x57/0x7019     [<c103ee33>] ? warn_slowpath_null+0x23/0x3020     [<c109e8a7>] ? module_put+0x57/0x7021     [<f80ca4d0>] ? gp8psk_fe_set_frontend+0x460/0x460 [dvb_usb_gp8psk]22     [<c109f617>] ? symbol_put_addr+0x27/0x5023     [<f80bc9ca>] ? dvb_usb_adapter_frontend_exit+0x3a/0x70 [dvb_usb]24     [<f80bb3bf>] ? dvb_usb_exit+0x2f/0xd0 [dvb_usb]25     [<c13d03bc>] ? usb_disable_endpoint+0x7c/0xb026     [<f80bb48a>] ? dvb_usb_device_exit+0x2a/0x50 [dvb_usb]27     [<c13d2882>] ? usb_unbind_interface+0x62/0x25028     [<c136b514>] ? __pm_runtime_idle+0x44/0x7029     [<c13620d8>] ? __device_release_driver+0x78/0x12030     [<c1362907>] ? driver_detach+0x87/0x9031     [<c1361c48>] ? bus_remove_driver+0x38/0x9032     [<c13d1c18>] ? usb_deregister+0x58/0xb033     [<c109fbb0>] ? SyS_delete_module+0x130/0x1f034     [<c1055654>] ? task_work_run+0x64/0x8035     [<c1000fa5>] ? exit_to_usermode_loop+0x85/0x9036     [<c10013f0>] ? do_fast_syscall_32+0x80/0x13037     [<c1549f43>] ? sysenter_past_esp+0x40/0x6a38    ---[ end trace 6ebc60ef3981792f ]---39
40Such stack traces provide enough information to identify the line inside the41Kernel's source code where the bug happened. Depending on the severity of42the issue, it may also contain the word **Oops**, as on this one::43
44    BUG: unable to handle kernel NULL pointer dereference at   (null)45    IP: [<c06969d4>] iret_exc+0x7d0/0xa5946    *pdpt = 000000002258a001 *pde = 000000000000000047    Oops: 0002 [#1] PREEMPT SMP48    ...49
50Despite being an **Oops** or some other sort of stack trace, the offended51line is usually required to identify and handle the bug. Along this chapter,52we'll refer to "Oops" for all kinds of stack traces that need to be analyzed.53
54If the kernel is compiled with ``CONFIG_DEBUG_INFO``, you can enhance the55quality of the stack trace by using file:`scripts/decode_stacktrace.sh`.56
57Modules linked in58-----------------59
60Modules that are tainted or are being loaded or unloaded are marked with61"(...)", where the taint flags are described in62file:`Documentation/admin-guide/tainted-kernels.rst`, "being loaded" is63annotated with "+", and "being unloaded" is annotated with "-".64
65
66Where is the Oops message is located?67-------------------------------------68
69Normally the Oops text is read from the kernel buffers by klogd and70handed to ``syslogd`` which writes it to a syslog file, typically71``/var/log/messages`` (depends on ``/etc/syslog.conf``). On systems with72systemd, it may also be stored by the ``journald`` daemon, and accessed73by running ``journalctl`` command.74
75Sometimes ``klogd`` dies, in which case you can run ``dmesg > file`` to76read the data from the kernel buffers and save it.  Or you can77``cat /proc/kmsg > file``, however you have to break in to stop the transfer,78since ``kmsg`` is a "never ending file".79
80If the machine has crashed so badly that you cannot enter commands or81the disk is not available then you have three options:82
83(1) Hand copy the text from the screen and type it in after the machine84    has restarted.  Messy but it is the only option if you have not85    planned for a crash. Alternatively, you can take a picture of86    the screen with a digital camera - not nice, but better than87    nothing.  If the messages scroll off the top of the console, you88    may find that booting with a higher resolution (e.g., ``vga=791``)89    will allow you to read more of the text. (Caveat: This needs ``vesafb``,90    so won't help for 'early' oopses.)91
92(2) Boot with a serial console (see93    :ref:`Documentation/admin-guide/serial-console.rst <serial_console>`),94    run a null modem to a second machine and capture the output there95    using your favourite communication program.  Minicom works well.96
97(3) Use Kdump (see Documentation/admin-guide/kdump/kdump.rst),98    extract the kernel ring buffer from old memory with using dmesg99    gdbmacro in Documentation/admin-guide/kdump/gdbmacros.txt.100
101Finding the bug's location102--------------------------103
104Reporting a bug works best if you point the location of the bug at the105Kernel source file. There are two methods for doing that. Usually, using106``gdb`` is easier, but the Kernel should be pre-compiled with debug info.107
108gdb109^^^110
111The GNU debugger (``gdb``) is the best way to figure out the exact file and line112number of the OOPS from the ``vmlinux`` file.113
114The usage of gdb works best on a kernel compiled with ``CONFIG_DEBUG_INFO``.115This can be set by running::116
117  $ ./scripts/config -d COMPILE_TEST -e DEBUG_KERNEL -e DEBUG_INFO118
119On a kernel compiled with ``CONFIG_DEBUG_INFO``, you can simply copy the120EIP value from the OOPS::121
122 EIP:    0060:[<c021e50e>]    Not tainted VLI123
124And use GDB to translate that to human-readable form::125
126  $ gdb vmlinux127  (gdb) l *0xc021e50e128
129If you don't have ``CONFIG_DEBUG_INFO`` enabled, you use the function130offset from the OOPS::131
132 EIP is at vt_ioctl+0xda8/0x1482133
134And recompile the kernel with ``CONFIG_DEBUG_INFO`` enabled::135
136  $ ./scripts/config -d COMPILE_TEST -e DEBUG_KERNEL -e DEBUG_INFO137  $ make vmlinux138  $ gdb vmlinux139  (gdb) l *vt_ioctl+0xda8140  0x1888 is in vt_ioctl (drivers/tty/vt/vt_ioctl.c:293).141  288   {142  289       struct vc_data *vc = NULL;143  290       int ret = 0;144  291145  292       console_lock();146  293       if (VT_BUSY(vc_num))147  294           ret = -EBUSY;148  295       else if (vc_num)149  296           vc = vc_deallocate(vc_num);150  297       console_unlock();151
152or, if you want to be more verbose::153
154  (gdb) p vt_ioctl155  $1 = {int (struct tty_struct *, unsigned int, unsigned long)} 0xae0 <vt_ioctl>156  (gdb) l *0xae0+0xda8157
158You could, instead, use the object file::159
160  $ make drivers/tty/161  $ gdb drivers/tty/vt/vt_ioctl.o162  (gdb) l *vt_ioctl+0xda8163
164If you have a call trace, such as::165
166     Call Trace:167      [<ffffffff8802c8e9>] :jbd:log_wait_commit+0xa3/0xf5168      [<ffffffff810482d9>] autoremove_wake_function+0x0/0x2e169      [<ffffffff8802770b>] :jbd:journal_stop+0x1be/0x1ee170      ...171
172this shows the problem likely is in the :jbd: module. You can load that module173in gdb and list the relevant code::174
175  $ gdb fs/jbd/jbd.ko176  (gdb) l *log_wait_commit+0xa3177
178.. note::179
180     You can also do the same for any function call at the stack trace,181     like this one::182
183     [<f80bc9ca>] ? dvb_usb_adapter_frontend_exit+0x3a/0x70 [dvb_usb]184
185     The position where the above call happened can be seen with::186
187    $ gdb drivers/media/usb/dvb-usb/dvb-usb.o188    (gdb) l *dvb_usb_adapter_frontend_exit+0x3a189
190objdump191^^^^^^^192
193To debug a kernel, use objdump and look for the hex offset from the crash194output to find the valid line of code/assembler. Without debug symbols, you195will see the assembler code for the routine shown, but if your kernel has196debug symbols the C code will also be available. (Debug symbols can be enabled197in the kernel hacking menu of the menu configuration.) For example::198
199    $ objdump -r -S -l --disassemble net/dccp/ipv4.o200
201.. note::202
203   You need to be at the top level of the kernel tree for this to pick up204   your C files.205
206If you don't have access to the source code you can still debug some crash207dumps using the following method (example crash dump output as shown by208Dave Miller)::209
210     EIP is at  +0x14/0x4c0211      ...212     Code: 44 24 04 e8 6f 05 00 00 e9 e8 fe ff ff 8d 76 00 8d bc 27 00 00213     00 00 55 57  56 53 81 ec bc 00 00 00 8b ac 24 d0 00 00 00 8b 5d 08214     <8b> 83 3c 01 00 00 89 44  24 14 8b 45 28 85 c0 89 44 24 18 0f 85215
216     Put the bytes into a "foo.s" file like this:217
218            .text219            .globl foo220     foo:221            .byte  .... /* bytes from Code: part of OOPS dump */222
223     Compile it with "gcc -c -o foo.o foo.s" then look at the output of224     "objdump --disassemble foo.o".225
226     Output:227
228     ip_queue_xmit:229         push       %ebp230         push       %edi231         push       %esi232         push       %ebx233         sub        $0xbc, %esp234         mov        0xd0(%esp), %ebp        ! %ebp = arg0 (skb)235         mov        0x8(%ebp), %ebx         ! %ebx = skb->sk236         mov        0x13c(%ebx), %eax       ! %eax = inet_sk(sk)->opt237
238file:`scripts/decodecode` can be used to automate most of this, depending239on what CPU architecture is being debugged.240
241Reporting the bug242-----------------243
244Once you find where the bug happened, by inspecting its location,245you could either try to fix it yourself or report it upstream.246
247In order to report it upstream, you should identify the mailing list248used for the development of the affected code. This can be done by using249the ``get_maintainer.pl`` script.250
251For example, if you find a bug at the gspca's sonixj.c file, you can get252its maintainers with::253
254    $ ./scripts/get_maintainer.pl -f drivers/media/usb/gspca/sonixj.c255    Hans Verkuil <hverkuil@xs4all.nl> (odd fixer:GSPCA USB WEBCAM DRIVER,commit_signer:1/1=100%)256    Mauro Carvalho Chehab <mchehab@kernel.org> (maintainer:MEDIA INPUT INFRASTRUCTURE (V4L/DVB),commit_signer:1/1=100%)257    Tejun Heo <tj@kernel.org> (commit_signer:1/1=100%)258    Bhaktipriya Shridhar <bhaktipriya96@gmail.com> (commit_signer:1/1=100%,authored:1/1=100%,added_lines:4/4=100%,removed_lines:9/9=100%)259    linux-media@vger.kernel.org (open list:GSPCA USB WEBCAM DRIVER)260    linux-kernel@vger.kernel.org (open list)261
262Please notice that it will point to:263
264- The last developers that touched the source code (if this is done inside265  a git tree). On the above example, Tejun and Bhaktipriya (in this266  specific case, none really involved on the development of this file);267- The driver maintainer (Hans Verkuil);268- The subsystem maintainer (Mauro Carvalho Chehab);269- The driver and/or subsystem mailing list (linux-media@vger.kernel.org);270- the Linux Kernel mailing list (linux-kernel@vger.kernel.org).271
272Usually, the fastest way to have your bug fixed is to report it to mailing273list used for the development of the code (linux-media ML) copying the274driver maintainer (Hans).275
276If you are totally stumped as to whom to send the report, and277``get_maintainer.pl`` didn't provide you anything useful, send it to278linux-kernel@vger.kernel.org.279
280Thanks for your help in making Linux as stable as humanly possible.281
282Fixing the bug283--------------284
285If you know programming, you could help us by not only reporting the bug,286but also providing us with a solution. After all, open source is about287sharing what you do and don't you want to be recognised for your genius?288
289If you decide to take this way, once you have worked out a fix please submit290it upstream.291
292Please do read293:ref:`Documentation/process/submitting-patches.rst <submittingpatches>` though294to help your code get accepted.295
296
297---------------------------------------------------------------------------298
299Notes on Oops tracing with ``klogd``300------------------------------------301
302In order to help Linus and the other kernel developers there has been303substantial support incorporated into ``klogd`` for processing protection304faults.  In order to have full support for address resolution at least305version 1.3-pl3 of the ``sysklogd`` package should be used.306
307When a protection fault occurs the ``klogd`` daemon automatically308translates important addresses in the kernel log messages to their309symbolic equivalents.  This translated kernel message is then310forwarded through whatever reporting mechanism ``klogd`` is using.  The311protection fault message can be simply cut out of the message files312and forwarded to the kernel developers.313
314Two types of address resolution are performed by ``klogd``.  The first is315static translation and the second is dynamic translation.316Static translation uses the System.map file.317In order to do static translation the ``klogd`` daemon318must be able to find a system map file at daemon initialization time.319See the klogd man page for information on how ``klogd`` searches for map320files.321
322Dynamic address translation is important when kernel loadable modules323are being used.  Since memory for kernel modules is allocated from the324kernel's dynamic memory pools there are no fixed locations for either325the start of the module or for functions and symbols in the module.326
327The kernel supports system calls which allow a program to determine328which modules are loaded and their location in memory.  Using these329system calls the klogd daemon builds a symbol table which can be used330to debug a protection fault which occurs in a loadable kernel module.331
332At the very minimum klogd will provide the name of the module which333generated the protection fault.  There may be additional symbolic334information available if the developer of the loadable module chose to335export symbol information from the module.336
337Since the kernel module environment can be dynamic there must be a338mechanism for notifying the ``klogd`` daemon when a change in module339environment occurs.  There are command line options available which340allow klogd to signal the currently executing daemon that symbol341information should be refreshed.  See the ``klogd`` manual page for more342information.343
344A patch is included with the sysklogd distribution which modifies the345``modules-2.0.0`` package to automatically signal klogd whenever a module346is loaded or unloaded.  Applying this patch provides essentially347seamless support for debugging protection faults which occur with348kernel loadable modules.349
350The following is an example of a protection fault in a loadable module351processed by ``klogd``::352
353    Aug 29 09:51:01 blizard kernel: Unable to handle kernel paging request at virtual address f15e97cc354    Aug 29 09:51:01 blizard kernel: current->tss.cr3 = 0062d000, %cr3 = 0062d000355    Aug 29 09:51:01 blizard kernel: *pde = 00000000356    Aug 29 09:51:01 blizard kernel: Oops: 0002357    Aug 29 09:51:01 blizard kernel: CPU:    0358    Aug 29 09:51:01 blizard kernel: EIP:    0010:[oops:_oops+16/3868]359    Aug 29 09:51:01 blizard kernel: EFLAGS: 00010212360    Aug 29 09:51:01 blizard kernel: eax: 315e97cc   ebx: 003a6f80   ecx: 001be77b   edx: 00237c0c361    Aug 29 09:51:01 blizard kernel: esi: 00000000   edi: bffffdb3   ebp: 00589f90   esp: 00589f8c362    Aug 29 09:51:01 blizard kernel: ds: 0018   es: 0018   fs: 002b   gs: 002b   ss: 0018363    Aug 29 09:51:01 blizard kernel: Process oops_test (pid: 3374, process nr: 21, stackpage=00589000)364    Aug 29 09:51:01 blizard kernel: Stack: 315e97cc 00589f98 0100b0b4 bffffed4 0012e38e 00240c64 003a6f80 00000001365    Aug 29 09:51:01 blizard kernel:        00000000 00237810 bfffff00 0010a7fa 00000003 00000001 00000000 bfffff00366    Aug 29 09:51:01 blizard kernel:        bffffdb3 bffffed4 ffffffda 0000002b 0007002b 0000002b 0000002b 00000036367    Aug 29 09:51:01 blizard kernel: Call Trace: [oops:_oops_ioctl+48/80] [_sys_ioctl+254/272] [_system_call+82/128]368    Aug 29 09:51:01 blizard kernel: Code: c7 00 05 00 00 00 eb 08 90 90 90 90 90 90 90 90 89 ec 5d c3369
370---------------------------------------------------------------------------371
372::373
374  Dr. G.W. Wettstein           Oncology Research Div. Computing Facility375  Roger Maris Cancer Center    INTERNET: greg@wind.rmcc.com376  820 4th St. N.377  Fargo, ND  58122378  Phone: 701-234-7556
其它摘引
https://gohalo.me/post/linux-kernel-hang-task-panic-introduce.html